Sample Donation Report Top
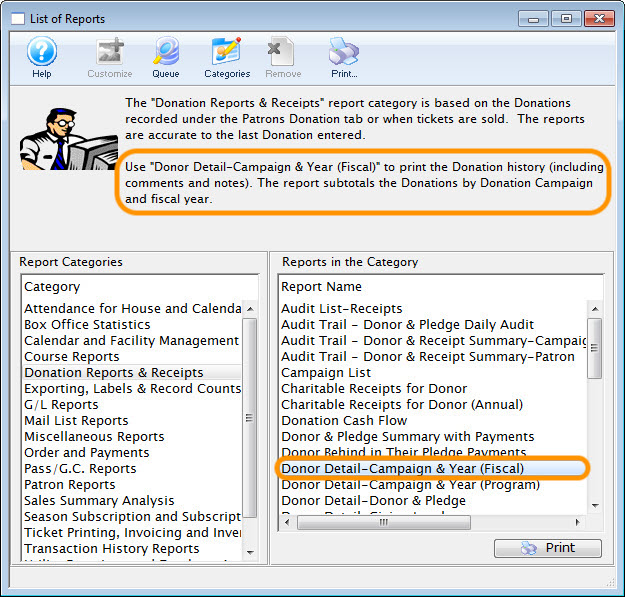
The Reports window lists the types of reports in the left-hand column called Report Categories. Each category has individual reports, listed in the right-hand column called Reports in the Category. For this sample, we've selected the Donor Detail-Campaign & Year (Fiscal) report in the Donation Reports & Receipts category. A brief description of the report appears at the top of the window when we single-click the report name.

To start building, we open the selected report. Every report has a Search tab to enter database criteria, a Titles tab for displaying custom report titles, and its own set of customizing tabs between Search and Titles that let you tailor each report to your specific needs. In this case, we have options for Address and Sort. We are also choosing to run this report without any limiting criteria in the Search tab, which will pull information from all donation records that exist in the database (not recommended except for demo databases with limited records).
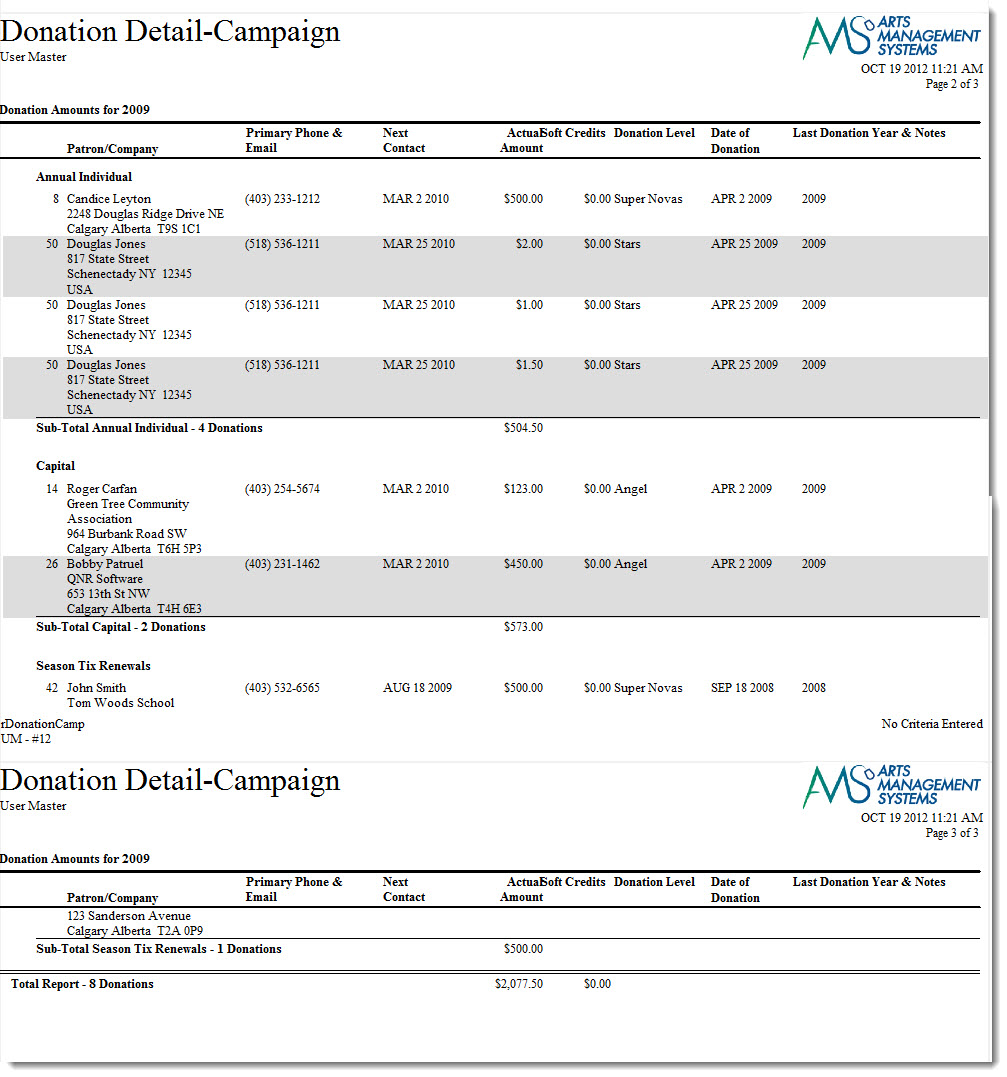
Here's a sample of this report with the default options left unchanged on the customizable Address, Sort, and Titles tabs. All reports show a title in the upper left corner with the user name underneath. The upper right corner displays your company's logo, the date and time the report was run, and the page number. All reports also show the Theatre Manager report name in the bottom left corner and, on the bottom right, a short preview of the criteria used on the Search tab to limit the report contents. Since we didn't enter any criteria in this example, the bottom right reads No Criteria Entered. Most reports show a grand total value on the last page of the report for any numerical fields (e.g. Actual Amount in this example).
This specific report breaks out donations by campaign, and shows a row of data for every unique donation. Notice that Douglas Jones, patron #50, gave three separate times on April 25th, once for $2 and twice for $1 each. Although there are a few notable exceptions, generally speaking you can customize some of the visual elements, including how a report is subtotaled, sorted, and paginated, but you cannot change the visible columns included on the final report (e.g. Primary Phone & Email, Next Contact, Actual Amount, Soft Credits, Donation Level, Date of Donation, and Last Donation Year & Notes in this sample). Theatre Manager has many reports within each category so that you can select which one contains relevant and easily readable information for a wide variety of reporting needs.
Once generated, you have a variety of options to save the report, such as printing, saving as a PDF, exporting to Excel, etc. Open reports in Theatre Manager also include links (in blue) so you can quickly open the detail records displayed in summary on the report (e.g. clicking on Patron # on the report will open that patron's record).
Sample Ticket Report Top
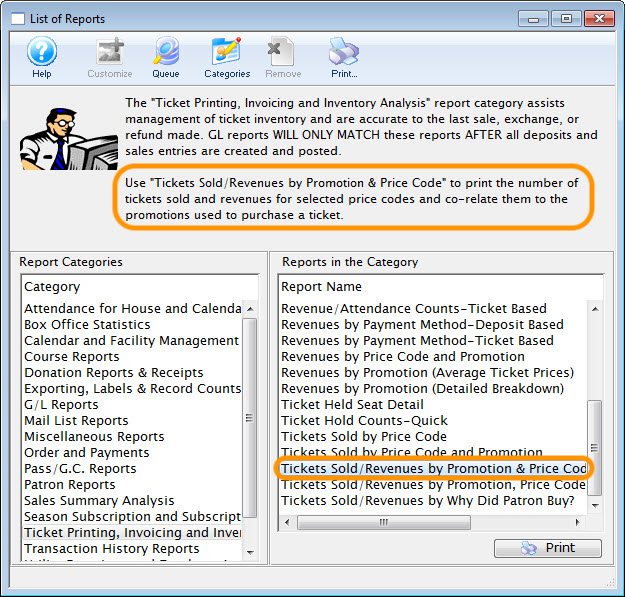
The Reports window lists the types of reports in the left-hand column called Report Categories. Each category has individual reports, listed in the right-hand column called Reports in the Category. For this sample, we've selected the Tickets sold/Revenues-By Promotion & Price Code report in the Ticket Printing, Invoicing and Inventory Analysis category. A brief description of the report appears at the top of the window when we single-click the report name.
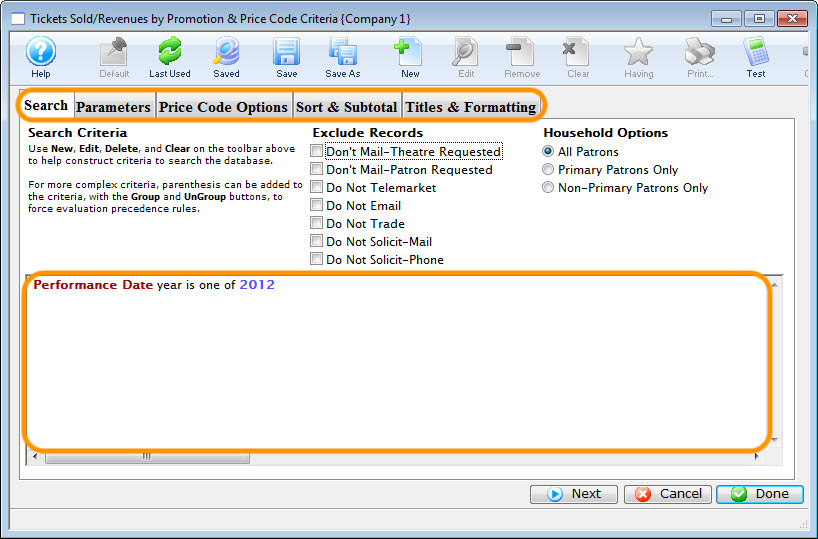
To start building, we open the selected report. Every report has a Search tab to enter database criteria, a Titles tab for displaying custom report titles, and its own set of customizing tabs between Search and Titles that let you tailor each report to your specific needs. In this case, we have options for Parameters, Price Code Options, and Sort & Subtotal. We are running this report with a single line of criteria in the Search tab: Performance Date year is one of 2012. This criteria will limit which information we display on the report to only those ticket records that were for a performance within the calendar year 2012.
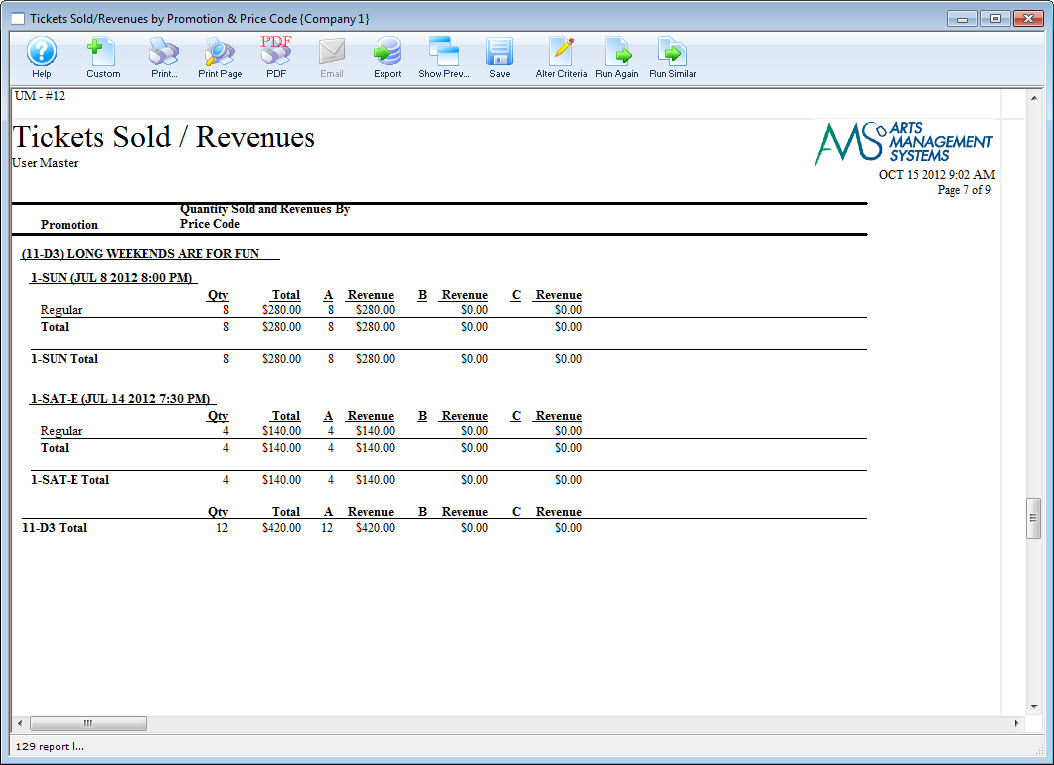
Here's a sample of this report with the default options left unchanged on the customizable tabs. All reports show a title in the upper left corner with the user name underneath. The upper right corner displays your company's logo, the date and time the report was run, and the page number. Though we do not show the bottom of the page in this example, all reports also show the Theatre Manager report name in the bottom left corner and, on the bottom right, a short preview of the criteria used on the Search tab to limit the report contents. Most reports show a grand total value on the last page of the report for any numerical fields (e.g. Qty and Total for every price code in this example).
This specific report breaks out ticket sales by event, performance, and sales promotion (only Regular was used in this case). Although there are a few notable exceptions, generally speaking you can customize some of the visual elements, including how a report is subtotaled, sorted, and paginated, but you cannot change the visible columns included on the final report (e.g. in this sample the Qty and Total for each performance and sales promotion, shown both for all price codes and then broken out for price codes A, B and C). Theatre Manager has many reports within each category so that you can select which one contains relevant and easily readable information for a wide variety of reporting needs.
Once generated, you have a variety of options to save the report, such as printing, saving as a PDF, exporting to Excel, etc. Open reports in Theatre Manager also include links (in blue) so you can quickly open the detail records displayed in summary on the report (e.g. clicking on * 911-D3) Long Weekends are For Fun* event title on the report will open that event detail record).